
|
Methods |
Psychophysical experiments usually seek to determine whether the subject can detect a stimulus, identify it, differentiate between it and another stimulus, as well as describe the magnitude or nature of this difference. Three methods are generally used for testing subjects' perception in these stimulus and difference detection experiments: the method of limits, the method of constant stimuli, and the method of adjustment (Snodgrass 1975). Psykinematix implements several of these psychophysical methods for measuring perception threshold and sensitivity: the method of constant stimuli, the method of adjustment (actually implemented as a procedure in Psykinematix, see the "Procedures" section), and two other adaptive methods considered as more efficient, the staircase and Bayesian methods.
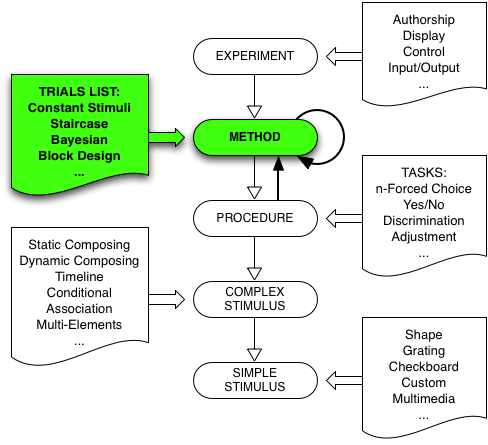
In Psykinematix, methods are events that specify the sequence of stimulus trials presented to the subject: method events specify how the dependent variables change with each trial, run the experimental loop by executing a procedure event for each trial (procedure events specify the trial task), and finally receive from the procedure events whether the subject's response to the trial was correct or incorrect. Each of the available methods specifies their own rules to control the stimuli parameters for each trial. Two of them (the adaptive ones) also use the results of a previous trial, as provided by a Procedure event, to set the stimuli parameters for the next trial. To learn more about psychophysical methods, check out the included references.
To create a new method make sure to first select an Experiment event in the Designer Panel, then:
Once one of the Method subcategories has been selected, changing
the method by clicking on other tabs is disabled unless the Control key is
pressed simultaneously. This is to prevent accidental changes because method
settings are then reset to default.
In the hierarchical experiment representation displayed in the Designer Panel, method events accept nodes of categories:
The method of constant stimuli collects performance for a given task at various levels of a stimulus property. The pre-selected stimulus levels are presented in random order, thus preventing the subject from being able to predict the level of the next trial, therefore reducing errors of habituation and expectation. The subject typically reports whether he or she can detect the stimulus. Note that it is possible to collect multiple responses for a given trial by embedding several sequential procedures in the same method of constant stimuli (for example to perform detection and discrimination tasks in the same session).
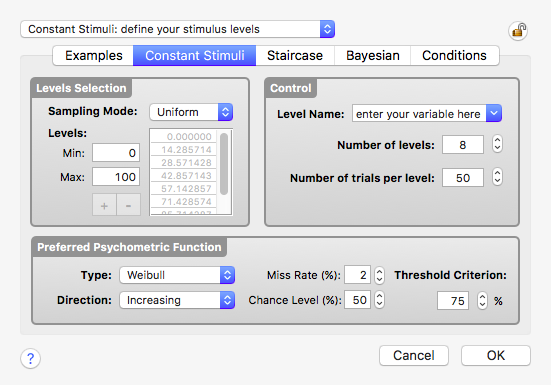
Properties for the method of constant stimuli are divided in 3 sections:
When the collection of the subject's responses is complete, this method provides a data set describing performance (% of correct responses) as a function of the dependent variable (levels). This data set is automatically fitted with the preferred psychometric function to derive threshold and slope. The fitting with the preferred psychometric function or any other function can be visualized in the Plotter Panel. Here is an example of a plot resulting from the method of constant stimuli:
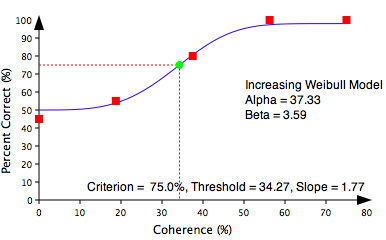
✍ If you are not very familiar with the method of constant stimuli and the use of psychometric functions, we highly recommend that you experiment with this interactive widget. This widget illustrates how psychometric functions work and help you learn how to appropriately select the stimulus levels and the psychometric function when collecting your experimental data using a method of constant stimuli: 1) start playing with the function parameters to get some intuition about their roles, 2) then play with the parameters generating the simulated data, and finally 3) challenge yourself to manually fit the presented data.
Often the method of constant stimuli is argued to be inefficient. This is because, prior to testing, the psychometric threshold is usually unknown and a lot of data has to be collected at points on the psychometric function that provide little information about its shape (the tails).
The next two methods are the adaptive ones which are considered more efficient since they require far fewer trials to reach similar estimates of threshold and slope (for a comprehensive introduction to the adaptive methods see for example Leek 2001).
The staircase method is more efficient for estimating the threshold, because the level samples are adaptively clustered around the psychometric threshold (Dixon & Mood 1948). The method works as follow:
The session starts with trials at suprathreshold levels, then, depending on the subject's responses, the next trials use either a higher or lower stimulus level based on a simple rule: the level is lowered after a given number of consecutive correct responses and raised after a number of consecutive incorrect responses. A reversal occurs when the stimulus level has been lowered and then subsequently raised. This process is repeated until a given number of reversals has been reached. The threshold is then estimated by averaging the values of the stimulus levels obtained for the last few reversals.
The increase and decrease rates, the number of reversals, and the number of consecutive responses can be customized in the properties panel (see Kaernbach 1991, Brown 1996, Garcia-Pérez 1998 for recommendations on the design of efficient and reliable staircases):
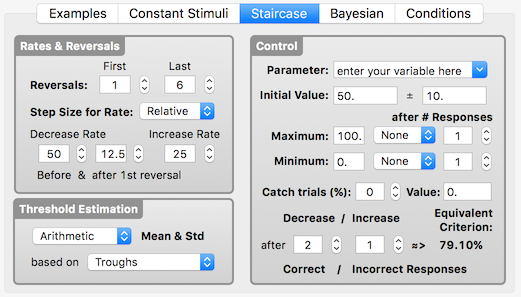
Properties for the staircase method are divided in 3 sections:
✍ If you are not very familiar with the staircase method, we highly recommend that you experiment with this interactive widget. This widget illustrates how the various staircase parameters affect the data collection and the threshold estimation (using a psychometric function as model of the decision process performed by a subject in a 2AFC task): 1) set the up/down rule of your staircase method by specifying the number of consecutive incorrect and correct responses as well as the increasing and decreasing rates. The indicated performance criterion is derived from these properties. 2) Select a psychometric function to model the decision process with some values for its alpha and beta parameters (the indicated data point in the right plot indicate the theoretical threshold at performance criterion for the decision process). 3) The left plot shows a simulated experiment using the specified staircase method and the decision model. Compare the estimated and theoretical thresholds as a function of the various parameters!
Here are few examples of plot obtained using this method once it is completed (see Plotter panel):
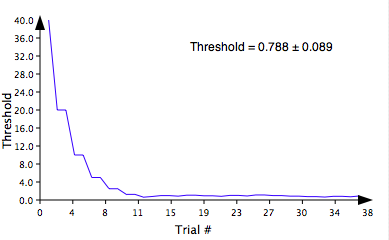
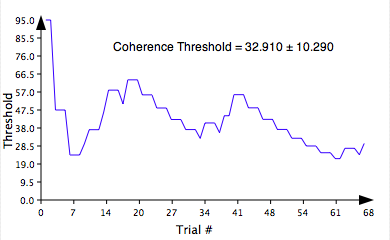
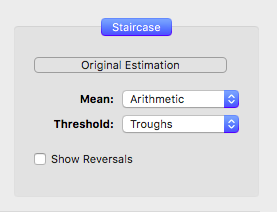
Note that, once plotted, the staircase results can be further customized by selecting how the threshold average is estimated:
It is important to note that the threshold estimate (mean±std) is displayed in red on the graph, instead of black, if it is not using the original settings specified in the Staircase properties (see Threshold Estimate section above). The original threshold estimate and the options used to calculate it are however still available by pressing the button Original Estimation.
The staircase method is relatively efficient, but at a cost: it does not generate the same amount of information regarding the shape of the psychometric function as do a method of constant stimuli. Despite this, it would be still possible to estimate the threshold and slope by fitting psychometric functions to the obtained data, although estimates of psychometric slope are likely to be more variable than those produced by the method of constant stimuli (for a reasonable sampling of the psychometric function).
Note: You may refer to lessons 1 of the available tutorials (Visual Acuity, Contrast Sensitivity, Orientation Discrimination) as they each use a staircase method to measure perception thresholds.
The next method provides an efficient way to estimate both threshold and slope by fitting a psychometric function on the fly using a Bayesian approach.
This Bayesian approach implements the Ψ method developed by Kontsevich and Tyler (1999). In short, based on Bayes’ rule, the method updates, according to the subject's response for each trial, the posterior probability distribution across the sampled space of a psychometric function. The space of the psychometric function is two-dimensional through the use of two parameters, Alpha and Beta, which control its sensitivity. Evaluation of the psychometric function is based on computing the mean of the posterior probability distribution. The placement of each new trial (stimulus level) is based on a one-step-ahead minimum search of the expected entropy cost function. The termination rule is based on the number of trials.
Note it is important to use the psychometric function that best fits the underlying decision process as Bayesian model. If not known, it is recommended to first use the method of constant stimuli to discover the best psychometric function, and then to apply it as a model in the Bayesian method.
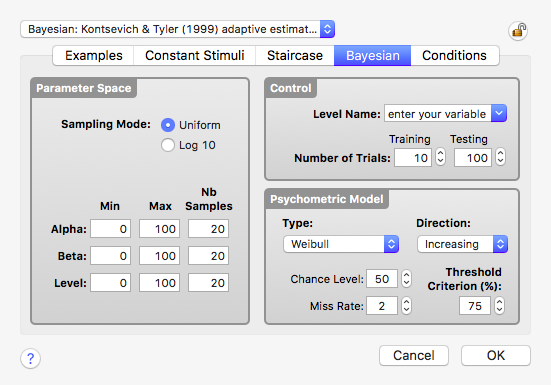
Properties for the Bayesian method are divided in 3 sections:
Here is an example of plots obtained using this method once it has been completed (see Plotter panel):
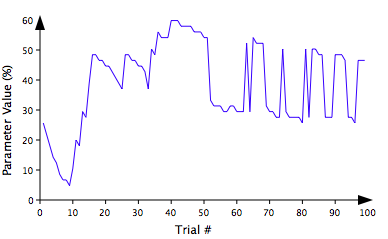
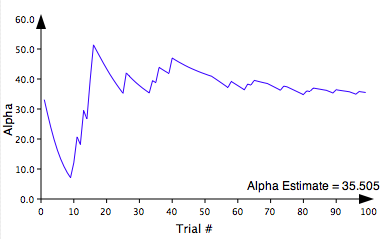
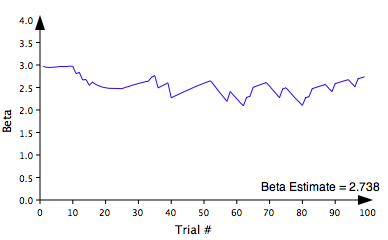
Note how fast the Bayesian method converges to produce asymptotic estimates of both Alpha and Beta parameters in fewer than 50 test trials. This method is also very stable since it requires fewer sessions compared to the staircase method which may produce more variable threshold estimates.
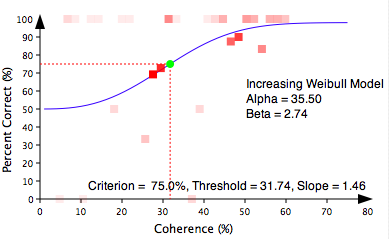
The psychometric function used by the Bayesian method can also be plotted for the asymptotic estimates of Alpha and Beta, along with the resulting threshold and slope for the specified performance criterion. The parameter levels used during the Bayesian estimation are also plotted with their scores (red squares) and the number of occurrences (shades of red for the squares).
The "Conditions" tab provides a convenient way to define blocks of trials with multiple conditions. Though this is not a method per se, this nonetheless specifies the sequence of trials for each condition in a session. Each condition can be associated with a list of variables, each variable can have one or more values, and each value instance can be repeated for a number of trials (see also "Control Variables" in "Using Variables & Expressions" section).
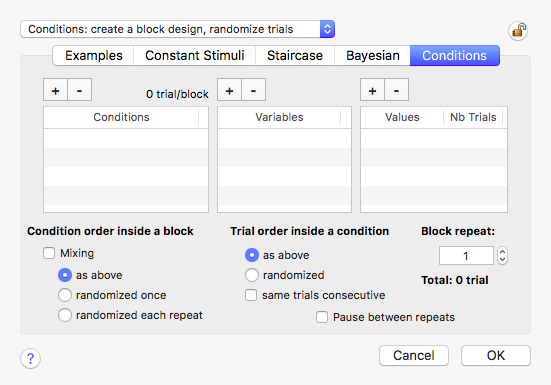
A block of trials may consist of several of such conditions and is specified using the three tables available in this panel:
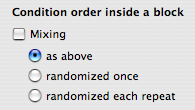
Below the tables, one can specify:
By specifying a list of trials through this "Conditions" method, you can then run the same task (defined by a Procedure event) for each of these trials without the need to specify any other method per se.
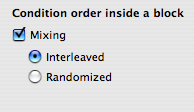
Interleaved method for multiple conditions:
However, it is sometimes desirable to run one of the three aforementioned methods (constant stimuli, staircase and bayesian) for multiple conditions in the same session. Psykinematix provides this capability by allowing these methods to be nested inside this "Conditions" event so trials for multiple conditions are automatically interleaved. In this case make sure to set the Nb Trials column to 1 in the Values table, and to select any option other than "as above" in the "Condition order inside a block" section to ensure that the conditions are randomly interleaved.
Note: You may refer to lessons 2 of some tutorials (Contrast Sensitivity, Orientation Discrimination) as they both use interleaved staircase methods to measure perception thresholds as a function of some independent variables.
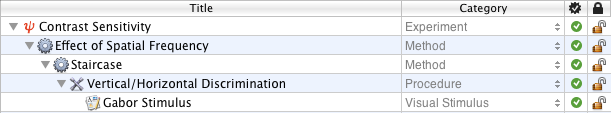
For example the “Conditions” event of the Contrast Sensitivity Tutorial named “Effect of Spatial Frequency” describes the different conditions (spatial frequencies) to be interleaved. Note that a single condition is specified in the Conditions table and several values are specified for the spatial frequency variable (sf).
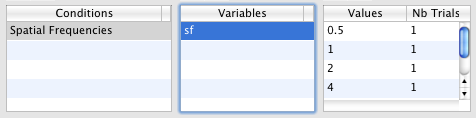
Below is the related experiment hierarchy. Note how the the method event named Staircase is nested inside the condition event: several staircase methods are then run interleaved, one for each spatial frequency condition, and the measured contrast thresholds are reported for each condition.
Brown, L.G. (1996) Additional rules for the transformed up-down method in psychophysics. Perception & Psychophysics, 58(6), 959-962 (HTML Link)
Cornsweet, T.N. (1962) The Staircase-Method in Psychophysics. The American Journal of Psychology, 75(3), 485-491
Dixon, W. J., & Mood, A. M. (1948) A Method for Obtaining and Analyzing Sensitivity Data. Journal of the American Statistical Association, 43(241), 109-126
Garcia-Pérez, M.A. (1998) Forced-choice staircases with fixed step sizes: asymptotic and small-sample properties. Vision Research, 38, 1861-1881 (HTML Link)
Kaernbach, C. (1991) Simple adaptive testing with the weighted updown method. Perception & Psychophysics, 49, 227-229 (HTML Link)
Kontsevich, L. L., & Tyler, C. W. (1999) Bayesian adaptive estimation of psychometric slope and threshold. Vision Research, 39, 2729–2737 (HTML Link)
Leek, M.R. (2001) Adaptive procedures in psychophysical research. Perception & Psychophysics, 63(8), 1279-1292 (HTML Link)
Snodgrass, J.G. (1975) Psychophysics. In: Experimental Sensory Psychology. B Scharf. (Ed.) pp. 17-67.
To learn more about Psychophysical Methods:
Gescheider, G. A. Psychophysics: The Fundamentals. Lawrence Erlbaum Ass. Publ., Mahwah, New Jersey, 1997.
Green, D.M., & Swets, J.A. Signal Detection Theory and Psychophysics. New York: Wiley, 1966.
Kingdom, F.A.A., & Prins, N. Psychophysics: A Practical Introduction. Academic Press: an imprint of Elsevier, London, In press.
© 2006-2024 KyberVision Japan LLC. All rights reserved.