Orientation Discrimination Lesson 2
You will learn how to duplicate an experiment, how to set experimental conditions through the Conditions method, and how to move the events using drag and drop. This lesson assumes you have been through the first lesson of this tutorial and became familiar with adding and inspecting the various types of events.
EFFECT OF SIZE AND SPATIAL FREQUENCY
This lesson makes the basic orientation discrimination task more elaborate by measuring the effect of size and spatial frequency of the Gabor stimuli. The measurements will be made through interleaved staircase methods each of them specifying one experimental condition.
Step 1. Duplicate the experiment
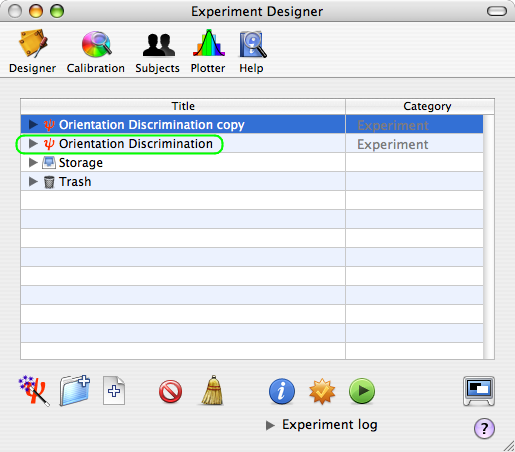
From the Designer panel, select the Orientation Discrimination experiment designed in lesson 1, and press the Apple-D keystroke (or select Duplicate from the Edit menu). The duplicate appears at the top level of the table with a suffix 'copy' added to the name of the original event. Rename the copy as Orientation Discrimination 2.
Tip: There are alternative ways for duplicating an event:
- using the regular Copy/Paste with the Apple-C & Apple-V keystrokes. The events copied this way are always pasted in the Storage area of the table.
- option-dragging an event makes a copy at the dragged position.
Step 2. Add and customize a "Conditions" Event
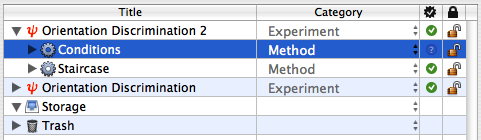
Select the Orientation Discrimination 2 experiment, reveal its hierarchy, and insert a new group event using the '+' FOLDER icon. Set the name and category of this new event to Conditions and Method, respectively.
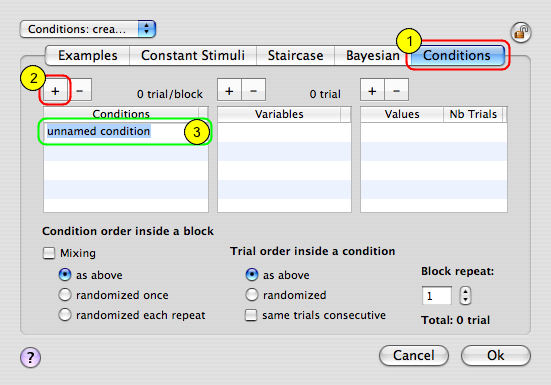
Select the new event Conditions, and click the INFO button to inspect and modify its properties:
1) Click on the Conditions tab to select the conditions builder;
2) Click the '+' button to add a new condition (named by default unnamed condition);
3) Rename it to Effect of size and sf.
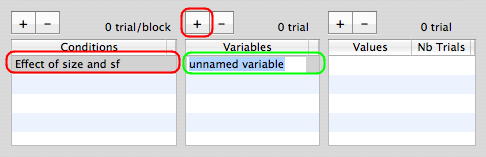
Make sure to select this new condition, and click the '+' button to add a new variable (named by default unnamed variable). Rename this variable to size.
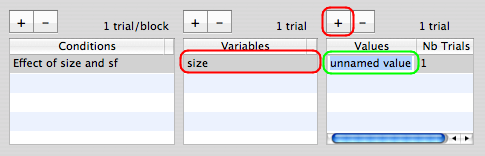
Make sure to select this new variable, and click the '+' button to add a new value (named by default unnamed value). Set this value to 0.5. Leave the number of trials to 1.
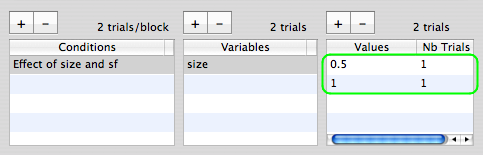
Add another value for the variable size and set it to 1.
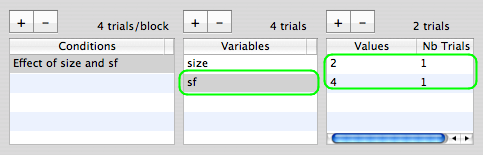
Add another variable named sf and set two values 2 and 4.
You just defined 4 experimental conditions: two variables (size, sf) which are the independent variables of this experimental design, each taking 2 values. The number of trials for each value was left to 1 because the actual number is unknown since it will depend on how fast the adaptive method (staircase) can estimate the threshold.
Click the OK button to validate the changes and return to the Designer panel.
Step 3. Update the hierarchy and the stimulus properties
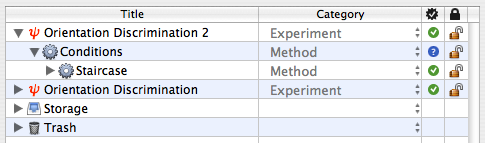
Click and drag the Staircase event INTO the Conditions event so it gets indented towards the right as illustrated. This way a staircase will run for each experimental condition defined above, and the different staircases will be presented interleaved.
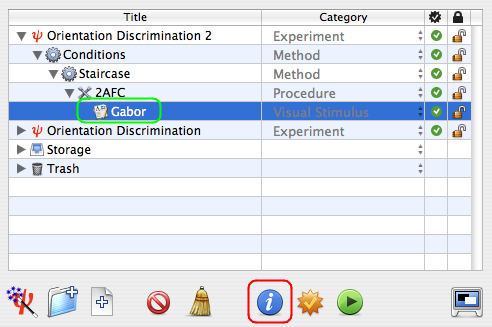
Option-click the arrow in front of the Staircase event to reveal the whole hierarchy down to the Gabor event.
Select the Gabor event and edit its properties by clicking the INFO button (or press Apple-i).
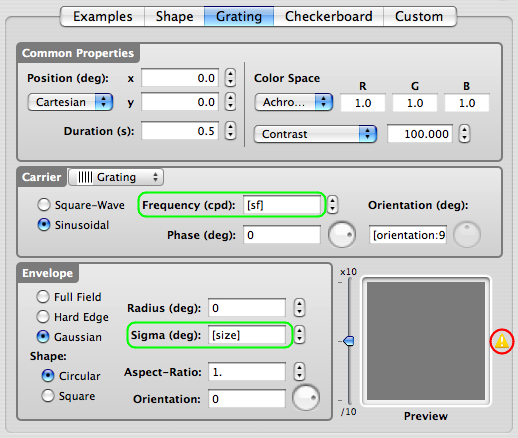
Finally, connect the variables sf and size we defined in the Conditions event to the spatial frequency and sigma parameters of the stimulus (select and control-click the text fields content and choose the appropriate variable in the contextual menu).
Note the little warning sign on the right of the preview that indicates the stimulus cannot be previewed. This is due in this particular case to the default value (0.) set to the sf variable. This will not affect in any way the normal operation of the experiment.
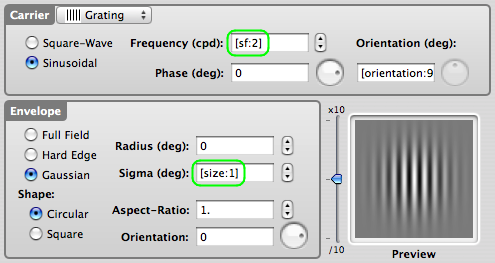
If you like to preview the stimulus with some realistic values for its parameters, just add a colon (:) followed by a value after the variable name between the brackets as illustrated.
Click the OK button to validate the changes, and return to the Designer panel.
Check & run the Experiment !
Step 4. Visualize the Results
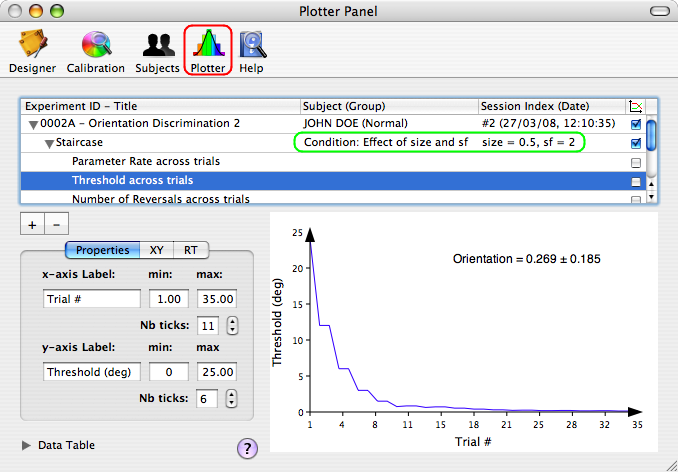
This is an example of results you obtain in the Plotter panel when selecting an entry in the results table for one of the experimental conditions.
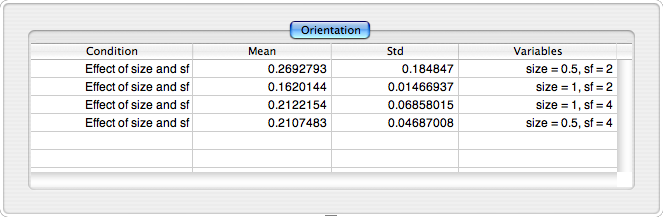
This is an example of results summary you obtain in the Data Table of the Plotter panel when selecting the root object in the table: mean and std for the measured thresholds are presented as function of the experimental condition.
See the "Import, Plot, Fit and Export Data" tutorial to learn more about the Plotter panel.
Conclusion
In this lesson, you learned how to duplicate an experiment, how to specify experimental conditions through a Conditions method, and how to move the events using drag and drop.