


Psychophysical experiments usually seek to determine whether the subject can detect a stimulus, identify it, differentiate between it and another stimulus, as well as describe the magnitude or nature of this difference. Three methods are generally used for testing subjects' perception in these stimulus and difference detection experiments: the method of limits, the method of constant stimuli, and the method of adjustment (Snodgrass 1975). Psykinematix implements several of these psychophysical methods for measuring perception threshold and sensitivity: the method of constant stimuli, the method of adjustment (actually implemented as a procedure in Psykinematix, see the "Procedures" section), and two other adaptive methods considered as more efficient, the staircase and Bayesian methods.

In Psykinematix, methods are events that specify the sequence of stimulus trials presented to the subject: method events specify how the dependent variables change with each trial, run the experimental loop by executing a procedure event for each trial (procedure events specify the trial task), and finally receive from the procedure events whether the subject's response to the trial was correct or incorrect. Each of the available methods specifies their own rules to control the stimuli parameters for each trial. Two of them (the adaptive ones) also use the results of a previous trial, as provided by a Procedure event, to set the stimuli parameters for the next trial. To learn more about psychophysical methods, check out the included references.
To create a new method make sure to first select an Experiment event in the Designer Panel, then:
- Add a new group event by clicking on the folder icon with the '+' symbol in the bottom toolbar. The new event appears at the top in the table with a default title “New Method”.
- Double-click on its title to edit it and reflect the method purpose,
- Using
the pop-up menu under the Category column, change the event
category from Undefined to one of the Method subcategories:
Method of Constant Stimuli
Staircase Method
Bayesian Method
Conditions
Note how the small icon in front of the event changes from a folder icon to an icon specific to the Method events. - Select the Method event and click on the Inspector button to edit its properties (or press ⌘I).
Once one of the Method subcategories has been selected, changing
the method by clicking on other tabs is disabled unless the Control key is
pressed simultaneously. This is to prevent accidental changes because method
settings are then reset to default.
In the hierarchical experiment representation displayed in the Designer Panel, method events accept nodes of categories:
The method of constant stimuli collects performance for a given task at various levels of a stimulus property. The pre-selected stimulus levels are presented in random order, thus preventing the subject from being able to predict the level of the next trial, therefore reducing errors of habituation and expectation. The subject typically reports whether he or she can detect the stimulus. Note that it is possible to collect multiple responses for a given trial by embedding several sequential procedures in the same method of constant stimuli (for example to perform detection and discrimination tasks in the same session).

Properties for the method of constant stimuli are divided in 3 sections:
- Control
- Level name is is the name of the stimulus property that varies across the trials (dependent variable of the experiment design). If the name does not appear in the pop-up menu, enter it in the associated text field. The same name must be used when customizing the properties of the stimulus event.
- Number of levels is the number of samples in the range defined by the minimum and maximum values, inclusive. It is recommanded to select enough levels so the the degree of freedom (df = number of levels - number of free parameters) is at least 3.
- Number of trials per level is the number of trials to present for each level.
- Levels Selection
- Sampling Mode is the selection mode, uniform, logarithmic or custom, which specifies how the level range is sampled to produce the various levels.
- Minimum and maximum levels are the minimum and maximum values of the level range. This range will be sampled to create the various levels according to how many there are and the selection mode. These minimum and maximum values will be included in the level samples. Note that both minimum and maximum level parameters can be specified using either numbers, variables, or any expressions.
The levels are presented in the attached table which is only editable using the custom selection mode: the '+' and '–' buttons can then be used to add or remove levels.
- Preferred Psychometric Function is the
function used to estimate the threshold and slope once the data collection
has been completed. Every available psychometric function is parameterized
by the Alpha and Beta parameters (see the "Data
Fitting" section for more details). If unknown, the appropriate
psychometric function can be selected later using the performance fitting
capabilities provided by the Plotter Panel.
- Type specifies the shape of the psychometric function (use ‘None’ if you don’t know yet),
- Direction specifies whether it is ascending or descending (use 'automatic' if the direction is unknown),
- Chance Level is the performance level at which subject decision is at chance (depending on the procedure, e.g. 50% for a 2AFC),
- Miss Rate (if known) is the discrepancy between the maximum measured performance and the ideal one (100%) for the highest stimulus level,
- Threshold Criterion is the performance level at which threshold and slope are measured.
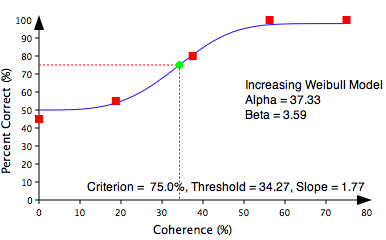
When the collection of the subject's responses is complete, this method provides a data set describing performance (% of correct responses) as a function of the dependent variable (levels). This data set is automatically fitted with the preferred psychometric function to derive threshold and slope. The fitting with the preferred psychometric function or any other function can be visualized in the Plotter Panel. Here is an example of a plot resulting from the method of constant stimuli:
✍ If you are not very familiar with the method of constant stimuli and the use of psychometric functions, we highly recommend that you experiment with this interactive widget. This widget illustrates how psychometric functions work and help you learn how to appropriately select the stimulus levels and the psychometric function when collecting your experimental data using a method of constant stimuli: 1) start playing with the function parameters to get some intuition about their roles, 2) then play with the parameters generating the simulated data, and finally 3) challenge yourself to manually fit the presented data.
Often the method of constant stimuli is argued to be inefficient. This is because, prior to testing, the psychometric threshold is usually unknown and a lot of data has to be collected at points on the psychometric function that provide little information about its shape (the tails).
The next two methods are the adaptive ones which are considered more efficient since they require far fewer trials to reach similar estimates of threshold and slope (for a comprehensive introduction to the adaptive methods see for example Leek 2001).
The staircase method is more efficient for estimating the threshold, because the level samples are adaptively clustered around the psychometric threshold (Dixon & Mood 1948). The method works as follow:
The session starts with trials at suprathreshold levels, then, depending on the subject's responses, the next trials use either a higher or lower stimulus level based on a simple rule: the level is lowered after a given number of consecutive correct responses and raised after a number of consecutive incorrect responses. A reversal occurs when the stimulus level has been lowered and then subsequently raised. This process is repeated until a given number of reversals has been reached. The threshold is then estimated by averaging the values of the stimulus levels obtained for the last few reversals.
The increase and decrease rates, the number of reversals, and the number of consecutive responses can be customized in the properties panel (see Kaernbach 1991, Brown 1996, Garcia-Pérez 1998 for recommendations on the design of efficient and reliable staircases):

Properties for the staircase method are divided in 2 sections:
- Control
- Parameter is is the name of the stimulus property whose level varies across the trials (dependent variable of the experiment design). If the name does not appear in the pop-up menu, enter it in the associated text field. The same name must be used when customizing the stimulus event so the method properly controls the level of the stimulus property under investigation.
- Initial value (mean ± range) value for the parameter will be chosen in the interval defined by mean ± range. The starting interval should correspond to a suprathreshold level. Note that both mean and range parameters can be specified using either numbers, variables, or any mathematical expression.
- Maximum value specifies the highest value the parameter is allowed to take during the staircase method. The way this value affects the method depends on the selected mode: "None" indicates it has no effect and the parameter may take any value (note that a warning or error message may be displayed in the experiment log window during the experiment); "Clamp" indicates that the value taken by the parameter will never be larger than the specified maximum value; "Abort" indicates that the method should stop as soon the parameter value exceeds this maximum value. Note that the maximum value can be specified using either a number, a variable, or any expression.
- Decrease after <n> correct responses is the number of consecutive correct responses before decreasing the parameter value.
- Increase after <p> incorrect responses is the number of consecutive incorrect responses before increasing the parameter value.
- Equivalent Criterion is the estimated probability for the threshold based on the number of p-up and n-down rules, the step asymmetry and the absolute vs relative mode (see below).
- Rates & Reversals
- First and last reversals define the set of reversals used to determine the threshold estimation. The response collection ends when the last reversal occurs.
- Step size indicates how the parameter value is changed
across trials, either in terms of relative rate expressed in % or in terms
of absolute units. Note that for absolute step size in particular, it is
important to make sure the resulting values make sense in terms of stimulus
properties. For example, if negative values are produced it may be
needed to use a "clamping" expression to limit the parameter
to some minimum values when specifying some stimulus properties:
-
min+rect([parameter]-min) where min is
the minimum value for [parameter]
so the evaluation results in:
min if [parameter] < min
[parameter] otherwise - Decrease rates before and after the first reversal are the decrease rates either in % for relative step size or absolute units to apply before and after the first actual reversal (not the one with its index specified above). They can be set so the parameter decreases faster at the start of the staircase until the first actual reversal occurs (first incorrect response), then so the decrease rate is reduced to a level which minimizes the risk of getting stuck at a level far below the psychometric threshold.
- Increase rate is the increase rate either in % for relative step size or absolute units to apply to the parameter value after each incorrect response.
✍ If you are not very familiar with the staircase method, we highly recommend that you experiment with this interactive widget. This widget illustrates how the various staircase parameters affect the data collection and the threshold estimation (using a psychometric function as model of the decision process performed by a subject in a 2AFC task): 1) set the up/down rule of your staircase method by specifying the number of consecutive incorrect and correct responses as well as the increasing and decreasing rates. The indicated performance criterion is derived from these properties. 2) Select a psychometric function to model the decision process with some values for its alpha and beta parameters (the indicated data point in the right plot indicate the theoretical threshold at performance criterion for the decision process). 3) The left plot shows a simulated experiment using the specified staircase method and the decision model. Compare the estimated and theoretical thresholds as a function of the various parameters!
Here are few examples of plot obtained using this method once it is completed (see Plotter panel):


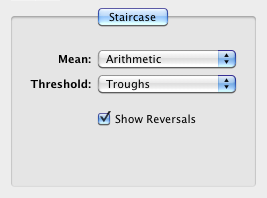
Note that, once plotted, the staircase results can be further customized by selecting how the threshold average is estimated:
- using an arithmetic or geometric mean with the associated standard deviation, ± or */ std,
- whether the troughs, the peaks or both are used in this estimation (only troughs are used by default).
with an option to highlight the reversal points in the graph.
The staircase method is relatively efficient, but at a cost: it does not generate the same amount of information regarding the shape of the psychometric function as do a method of constant stimuli. Despite this, it would be still possible to estimate the threshold and slope by fitting psychometric functions to the obtained data, although estimates of psychometric slope are likely to be more variable than those produced by the method of constant stimuli (for a reasonable sampling of the psychometric function).
The next method provides an efficient way to estimate both threshold and slope by fitting a psychometric function on the fly using a Bayesian approach.
This Bayesian approach implements the Ψ method developed by Kontsevich and Tyler (1999). In short, based on Bayes’ rule, the method updates, according to the subject's response for each trial, the posterior probability distribution across the sampled space of a psychometric function. The space of the psychometric function is two-dimensional through the use of two parameters, Alpha and Beta, which control its sensitivity. Evaluation of the psychometric function is based on computing the mean of the posterior probability distribution. The placement of each new trial (stimulus level) is based on a one-step-ahead minimum search of the expected entropy cost function. The termination rule is based on the number of trials.
Note it is important to use the psychometric function that best fits the underlying decision process as Bayesian model. If not known, it is recommended to first use the method of constant stimuli to discover the best psychometric function, and then to apply it as a model in the Bayesian method.

Properties for the Bayesian method are divided in 3 sections:
- Control
- Level Name is is the name of the stimulus property that varies across the trials (dependent variable of the experiment design). If the name does not appear in the pop-up menu, enter it in the associated text field. The same name must be used when customizing the properties of the stimulus event.
- Number of Training and Testing Trials are the number of training trials performed before starting the testing trials, as well as the total number of testing trials.
- Psychometric Function is the model used in the Bayesian estimation of the threshold and slope.
The Alpha and Beta parameters apply to each type of psychometric function (see the "Data Fitting" section for more details).
- Type specifies the shape of the psychometric function,
- Direction specifies whether it is ascending or descending,
- Chance Level is the performance level at which subject decision is at chance (depending on the procedure, e.g. 50% for a 2AFC),
- Miss Rate (if known) is the discrepancy between the maximum measured performance and the ideal one (100%) for the highest stimulus level,
- Threshold Criterion is the performance level at which threshold and slope are reported.
- Parameter Space defines the space upon
which the sensitivity of the psychometric function is measured. The psychometric
space is specified through the sampling (uniform or logarithmic, minimum
and maximum values, and number of samples) of two parameters, Alpha and Beta,
which control the sensitivity. The stimulus level is also sampled with the
specified sampling parameters (mode, range values, and number of samples)
for which the entropy of the probability density function is computed over
the space of psychometric functions.
- Sampling Mode is the selection mode, uniform or logarithmic, which specifies how the level range is sampled to produce the various levels,
- Minimum and Maximum Values are the minimum and maximum values for each parameter,
- Number of Samples is the number of samples for each parameter.
Here is an example of plots obtained using this method once it has been completed (see Plotter panel):


Note how fast the Bayesian method converges to produce asymptotic estimates of both Alpha and Beta parameters in fewer than 50 test trials. This method is also very stable since it requires fewer sessions compared to the staircase method which may produce more variable threshold estimates.

The psychometric function used by the Bayesian method can also be plotted for the asymptotic estimates of Alpha and Beta, along with the resulting threshold and slope for the specified performance criterion. The parameter levels used during the Bayesian estimation are also plotted with their scores (red squares) and the number of occurrences (shades of red for the squares).
The "Conditions" tab provides a convenient way to define blocks of trials with multiple conditions. Though this is not a method per se, this nonetheless specifies the sequence of trials for each condition in a session. Each condition can be associated with a list of variables, each variable can have one or more values, and each value instance can be repeated for a number of trials (see also "Control Variables" in "Using Variables & Expressions" section).

A block of trials may consist of several of such conditions and is specified using the three tables available in this panel:
- The Conditions table contains a list of conditions that defines a single block. These conditions can have arbitrary unique names and each should be associated with a list of independent variables displayed in the second table. Note that these condition names can be used in the conditional composing to select and display different stimuli based on the condition associated with the current trial (the functional equivalent of the switch statement in Matlab or C languages): the selected stimulus then uses the specified values for the parameters associated with the condition (see below).
- The Variables table contains the list of independent variables that affect the condition selected in the Conditions table. Each of these variables should be associated with a list of values displayed in the third table. Note that the variables declared in this table should not be declared anywhere else (like in the Independent Variables table under the "Control Settings" tab of the Experiment Properties Panel).
- The Values table contains the list of values taken by the variable selected in the Variables table. Each specified value can be presented a number of times by specifying a number of trials (1 by default). Note that these values are necessarily specified using scalars (ie: expressions are not supported yet). Since several values can be specified for the same variable, the nature of the condition under the Conditions table should not be affected by these values; otherwise it would be necessary to create different conditions in the Conditions table, each specifying a single and different value for the variable.
Below the tables, one can specify:
- The order of the conditions inside a block: since a block may consist of several conditions, it is important to specify properly their presentation order. When the conditions are not mixed inside a block, each condition is presented for a number of consecutive trials (based on the number of variables, their values and number of instances specified in the Variables and Values tables), and the condition order inside this block follows the order either as indicated in the "Conditions" table, randomized once or for each repeat.
When the conditions are mixed inside a block, the trials for each condition are either interleaved or randomized.


- The order of trials inside a condition: since a condition in a block may consist of multiple trials (because several values are specified for a given variable), it is also important to specify properly their presentation order. The order of trials for the same condition but different variables values either follows the order defined in the table (top entries are presented first) or get randomized. Optionally, trials for the same variables values (ie. instance numbers) can be presented consecutively rather than randomly.
- The number of block repeats: the block can be repeated a number of times in the same session. Note that the total number of trials that will be presented in the session is clearly indicated.
By specifying a list of trials through this "Conditions" method, you can then run the same task (defined by a Procedure event) for each of these trials without the need to specify any other method per se.
Interleaved method for multiple conditions:
However, it is sometimes desirable to run one of the three aforementioned methods (constant stimuli, staircase and bayesian) for multiple conditions in the same session. Psykinematix provides this capability by allowing these methods to be nested inside this "Conditions" event so trials for multiple conditions are automatically interleaved. In this case make sure to set the Nb Trials column to 1 in the Values table, and to select any option other than "as above" in the "Condition order inside a block" section to ensure that the conditions are randomly interleaved.
For example the “Conditions” event of the Contrast
Sensitivity Tutorial named “Effect of Spatial Frequency” describes
the different conditions (spatial frequencies) to be interleaved. Note that a
single condition is specified in the Conditions table and several
values are specified for the spatial frequency variable (sf).

Below is the related experiment hierarchy. Note how the the method event named Staircase is nested inside the condition event: several staircase methods are then run interleaved, one for each spatial frequency condition, and the measured contrast thresholds are reported for each condition.

Brown, L.G. (1996) Additional rules for the transformed up-down method in psychophysics. Perception & Psychophysics, 58(6), 959-962 (HTML Link)
Cornsweet, T.N. (1962) The Staircase-Method in Psychophysics. The American Journal of Psychology, 75(3), 485-491
Dixon, W. J., & Mood, A. M. (1948) A Method for Obtaining and Analyzing Sensitivity Data. Journal of the American Statistical Association, 43(241), 109-126
Garcia-Pérez, M.A. (1998) Forced-choice staircases with fixed step sizes: asymptotic and small-sample properties. Vision Research, 38, 1861-1881 (HTML Link)
Kaernbach, C. (1991) Simple adaptive testing with the weighted updown method. Perception & Psychophysics, 49, 227-229 (HTML Link)
Kontsevich, L. L., & Tyler, C. W. (1999) Bayesian adaptive estimation of psychometric slope and threshold. Vision Research, 39, 2729–2737 (HTML Link)
Leek, M.R. (2001) Adaptive procedures in psychophysical research. Perception & Psychophysics, 63(8), 1279-1292 (HTML Link)
Snodgrass, J.G. (1975) Psychophysics. In: Experimental Sensory Psychology. B Scharf. (Ed.) pp. 17-67.
To learn more about Psychophysical Methods:
Gescheider, G. A. Psychophysics: The Fundamentals. Lawrence Erlbaum Ass. Publ., Mahwah, New Jersey, 1997.
Green, D.M., & Swets, J.A. Signal Detection Theory and Psychophysics. New York: Wiley, 1966.
Kingdom, F.A.A., & Prins, N. Psychophysics: A Practical Introduction. Academic Press: an imprint of Elsevier, London, In press.