Visual Acuity: Lesson 2
In this lesson, you will learn how to:
- duplicate an experiment,
- use a timeline to present simultaneous stimuli,
- create shape stimuli.
This lesson assumes you have been through Lesson 1 of this tutorial and become familiar with adding and inspecting the various types of events.
EFFECT OF CROWDING BARS
In Lesson 1, you learned how to create a basic experiment to measure visual acuity threshold for single letters. This lesson makes the basic visual acuity task more elaborate by measuring the effect of crowding bars which is known to be significant in amblyopic subjects.
Step 1: Duplicating the Experiment
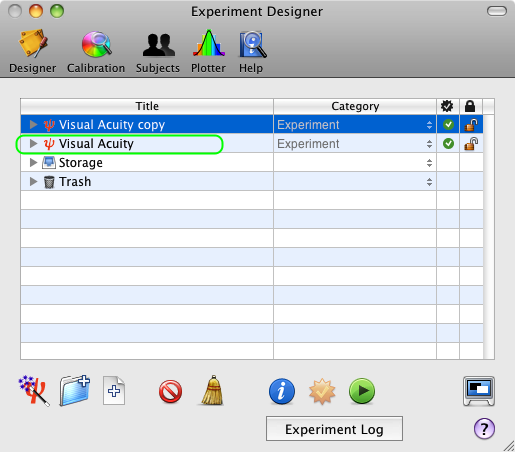
From the Designer panel, select the Visual Acuity experiment designed in Lesson 1, and press the Apple-D keystroke (or select Duplicate from the Edit menu). The duplicate appears at the top level of the table with the 'copy' suffix added to the name of the original event. Rename the copy as Visual Acuity 2.
Tip: There are alternative ways to duplicate an event:
- Using the regular Copy/Paste with the Apple-C & Apple-V keystrokes; events copied this way are always pasted in the Storage area of the table.
- Option-drag an event to make a copy at the dragged position.
To add crowding bars to the optotypes, one needs to create 4 bar stimuli presented simultaneously on the left and the right of the optotypes, and above and below them.
Step 2: Adding a Timeline Event
First, we will add a timeline event:
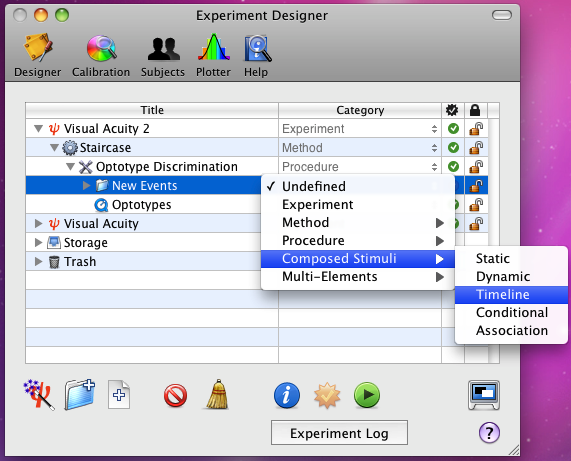
1) option-click on the arrow in front of the Visual Acuity 2 experiment to reveal its whole hierarchy,
2) select the Optotype Discrimination event and click on the '+' folder icon to add a new group event,
3) set the name and category of this event to Timeline and Composed Stimuli/Timeline, respectively.
Step 3: Adding the Crowding Bars
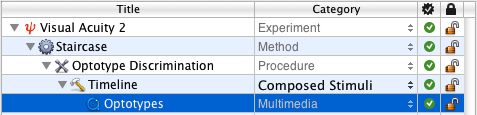
Click on and drag the Optotypes event INTO the Timeline event so it is indented as illustrated.
We will now add bar stimuli as the same level as the Optotypes stimuli so they will appear in the same timeline:
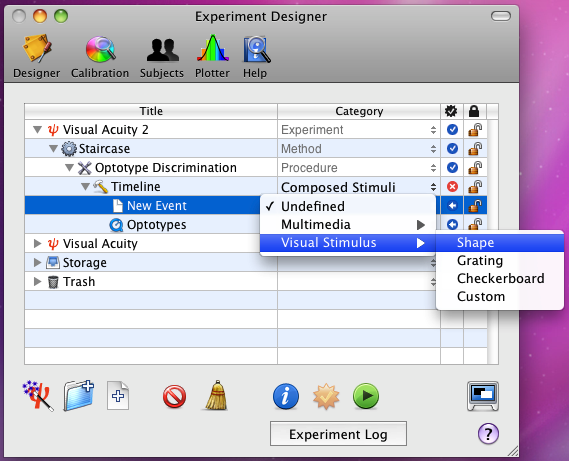
1) select the Timeline event you just created and add a new leaf event by clicking on the file icon with the '+' symbol in the bottom toolbar,
2) set the name and category of this event to Left Bar and Visual Stimulus/Shape, respectively.
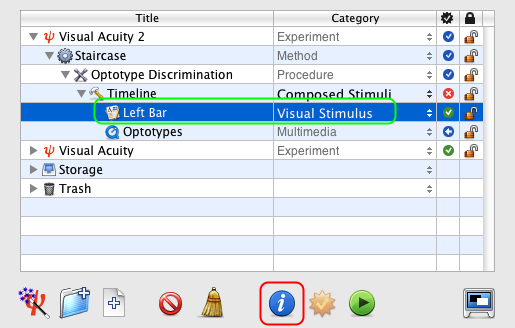
Select the Left Bar event and edit its properties by clicking on the Inspect button (or press Apple-i).
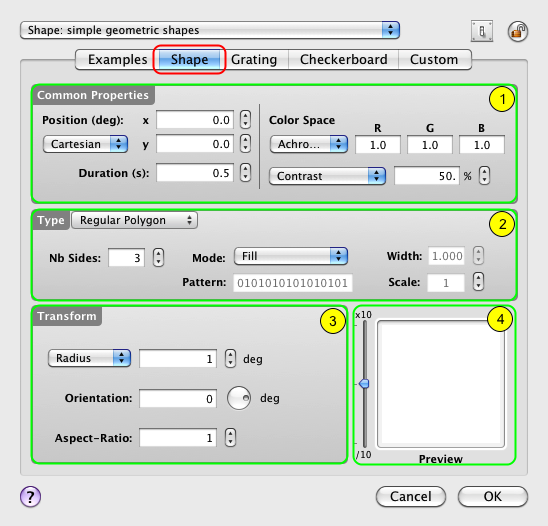
In the properties panel, control-click on the Shape tab to select the Shape Stimulus if it is not yet selected.
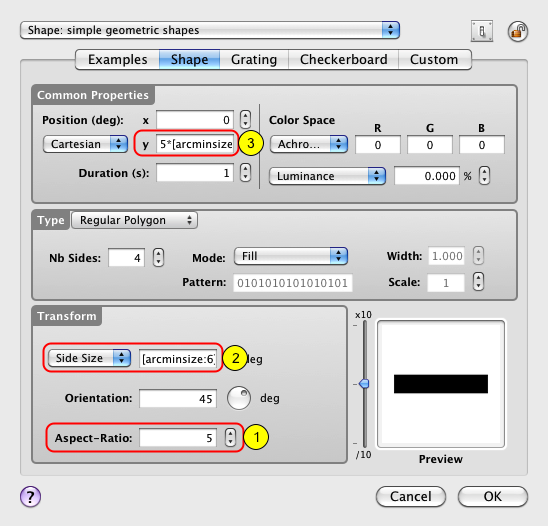
The properties page for the Visual Stimulus event consists of four sections:
1) A top section common to all types of visual stimulus that specifies their position, duration, and appearance,
2) A middle section that specifies the basic shape properties,
3) A bottom-left section that specifies the transforms to be applied on the shape,
4) A real-time preview in the bottom right-hand corner that can be zoomed in and out.
Let's customize each of these sections to create a vertical bar:
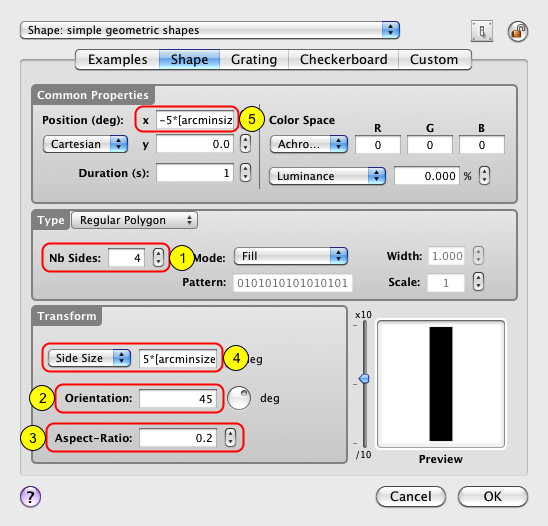
1) set the number of sides to 4 to create a parallelogram,
2) set its orientation to 45 deg to specify a rectangle shape,
3) set its aspect-ratio to 1/5 so the rectangle is 5 times taller than it is wide,
4) indicate the rectangle size to be specified in terms of its Side Size rather than its Radius and set the side size (rectangle height) to the optotype height expressed in deg: 5*[arcminsize:6]/60
Remember that arcminsize refers to the thickness of the letter strokes in the Sloan font in arc minutes and that the width and height of each Sloan optotype corresponds to 5 times this stroke thickness. Note also the colon (:) after the variable name followed by a value, all between brackets. This indicates the value to be used for the variable in the stimulus preview (it is otherwise set to 0 by default), but does not effect the normal operation of the experiment in any way.
5) set the bar horizontal position to the left of the optotype at the desired distance, eg. with a separating space of half the optotype size: -5*[arcminsize:6]/60
Click on the OK button to validate the changes and return to the Designer panel.
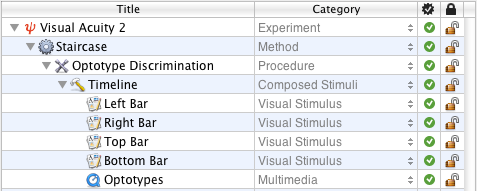
Now create the additional bars by duplicating 3 times the Left Bar stimulus and rename the copies to Right Bar, Top Bar and Bottom Bar as illustrated.
For the horizontal bars (Top Bar and Bottom Bar) modify their properties as follows:
1) set their aspect-ratio to 5 so the rectangle is 5 times wider than it is tall,
2) reduce the side size (rectangle height) to the stroke thickness expressed in deg: [arcminsize:6]/60
3) set the bar vertical position to above or below the optotype at the desired distance: ± 5*[arcminsize:6]/60
Click on the OK button to validate the changes and return to the Designer panel.
Step 4: Finalize the Timeline Event
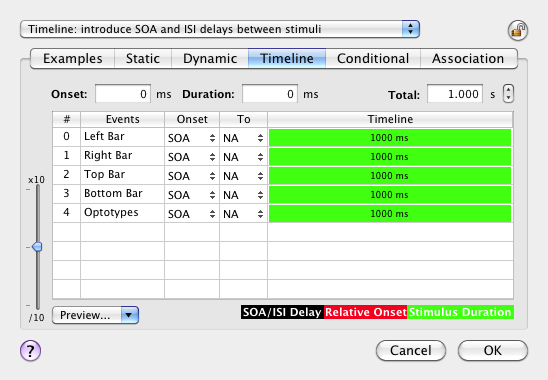
Edit the properties of the Timeline event to verify that each stimulus event appear correctly inside the timeline, that is presented simultaneously and for the same duration. Then click on the OK button to return to the Designer panel.
You can now run the experiment and measure visual acuity in presence of crowding bars!
Conclusion
In this lesson, you learned how to duplicate an experiment, use a timeline to present simultaneous stimuli, and create shape stimuli. You also learned how to inspect each level of the results hierarchy. Most important, you learned in Lessons 1 and 2 how to create a complete experiment to measure visual acuity, one of the most fundamental properties of the visual system.
If you wish to expand this experiment by adding temporal masking or spatial context to the stimulus, or by using dynamic stimuli, you should consider the following lessons to learn how to:
- interleave several staircases to investigate the effect of another parameter (Lesson 2 on Contrast Sensitivity),
- implement a sandwich paradigm with forward and feedback masking noise (Lesson 3 of Orientation Discrimination),
- add a spatial and temporal context (Lesson 4 of Orientation Discrimination).