Visual Acuity: Lesson 1
This step-by-step tutorial teaches you how to build and run your first experimental design for measuring visual acuity. More specifically, you will learn how to:
1) create the hierarchical structure of a basic experiment,
2) customize the events,
3) use variables to connect procedural and stimulus events,
4) run the experiment,
5) and visualize the results!
BASIC TASK
The aim of this experiment is to measure visual acuity using Sloan optotypes. While one could use bitmap images of these optotypes, one could also use a Sloan font. Such a font is available from Denis Pelli's software web page. To install it on your Mac, download version 2 of the font (Sloan.otf), unzip it, double-click on the otf file to open it using the Mac OS X Font Book application, and click on the Install Font button. The font will then be available to every application running on your system (Psykinematix included).
Step 1: Opening the "Designer" Panel
Launch Psykinematix, and select the Designer panel by clicking on its icon in the toolbar.
Step 2: Adding an Experiment Event
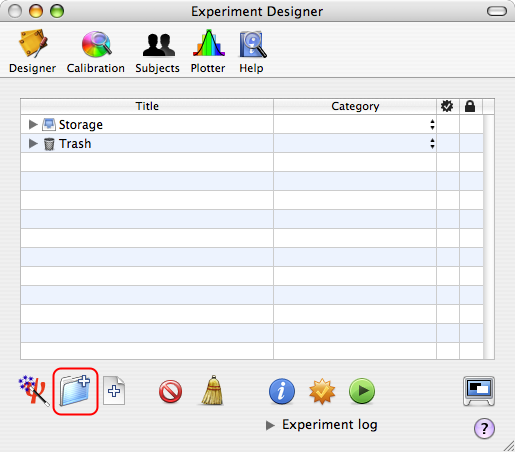
The Experiment Designer panel presents a hierarchical view of the experiments. Before going further, make sure to deselect any event by clicking on an empty row or Apple-clicking on the selected event to deselect it.
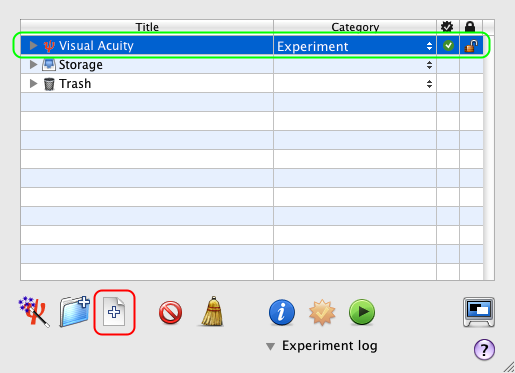
Now, create a new group event by clicking on the folder icon with the '+' symbol in the bottom toolbar.
Tip: A group event embeds one or several other events.
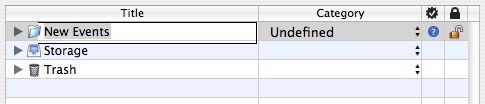
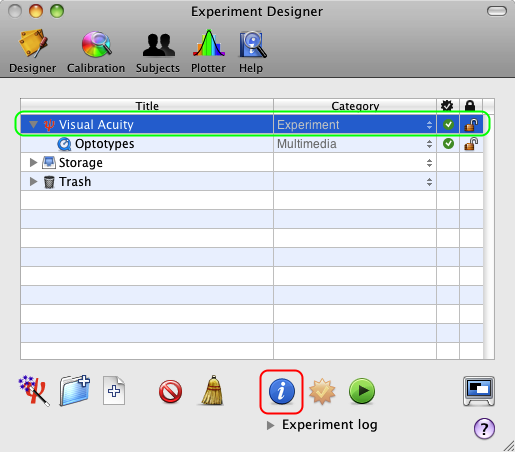
The new event appears at the top in the table with a default title (New Events). Change its title to Visual Acuity to reflect the experiment purpose (double-click on the title to edit it).
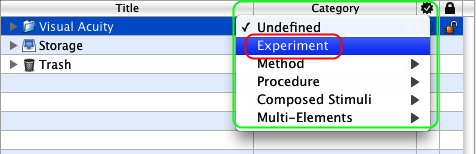
Each event is characterized by a category that defines its function inside your experimental design. To change the default category (Undefined), use the pop-up menu to select the Experiment entry. Note how the small icon in front of the event changed from a small folder to a small red psi icon specific to the Experiment event.
Tips:
Each category of events has its own small icon to depict its function.
The Undefined category can still be used to group several experiments under one roof (eg: all experiments related to the same study).
Step 3: Adding the Optotype Stimuli
Select the Experiment event you just created (Visual Acuity), and add a new leaf event by clicking on the file icon with the '+' symbol in the bottom toolbar.
Tip: As atomic events, leaf events do not embed other events hence the absence of the small arrow in front of their descriptive mini-icon.
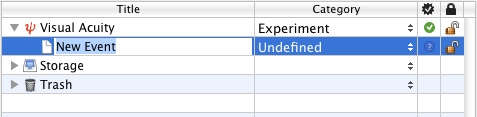
Change its title to Optotypes.
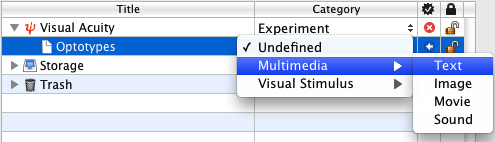
Change its category to Multimedia Text as illustrated.
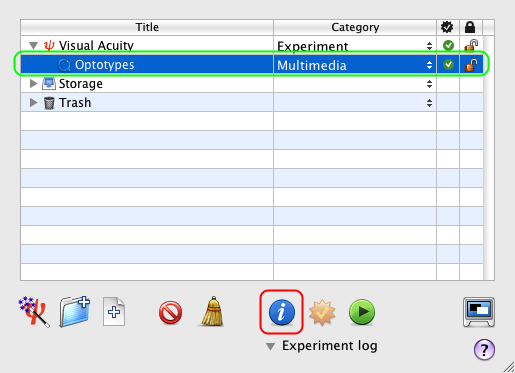
Click on the Optotypes event to select it, and click on the Inspector button (or press the Apple-i keystroke) to inspect the properties of the Multimedia Text.
Step 4: Customizing the Visual Stimulus
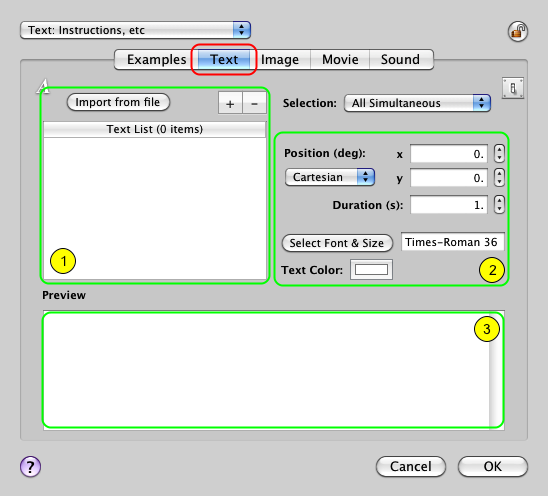
In the properties panel, control-click on the Text tab to select the Text Stimulus if it is not yet selected.
The properties panel for the Multimedia Text event consists of three sections:
1) a top left section that specifies the content of each line of text,
2) a top right section that specifies the position, duration, and appearance of each line of text,
3) a preview in the bottom section of the currently selected line of text.
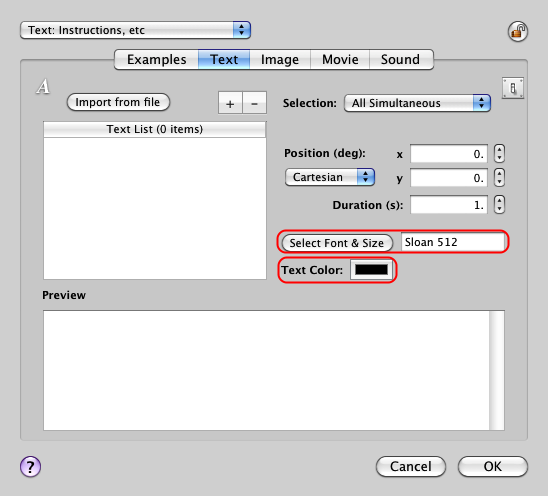
Change the default color to be applied to each line of text to black as well as the default font type and size to "Sloan 512".
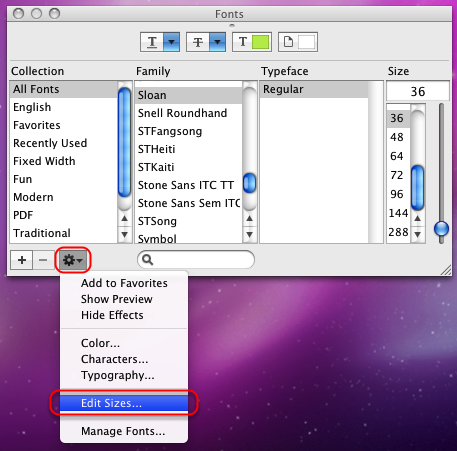
If the size of 512 pixels is not available, click on the dented wheel button to access the font menu and select Edit Sizes...
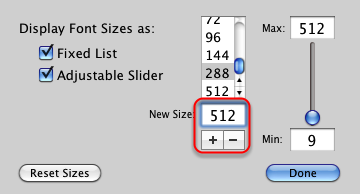
Add the new size of 512 pixels so it appears in the list and click on the Done button to validate.
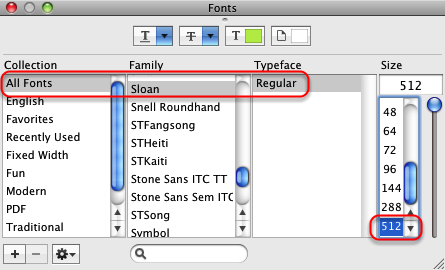
Select the Sloan font and the 512 pixels size before closing the Fonts palette. Sloan 512 should appear in the font & size text field when returning to the properties panel.
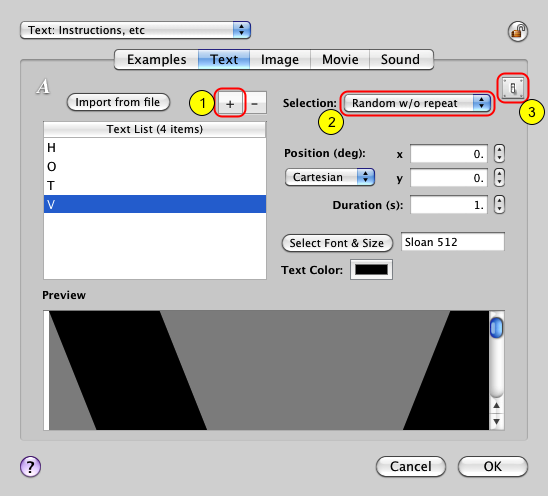
1) now that we have defined the default properties of the text, we can enter each optotype: click on the '+' button for each letter and edit the text entry in the table. In this example, the 4 Sloan letters HOTV will be used to measure visual acuity.
2) change the Selection mode from All simultaneous to Random & reshuffle: this indicates that a single randomly selected text entry will be displayed in each trial, each letter being equiprobable in each selection block. The value of the system-defined variable [SELECTION] will be automatically updated with the selection (here 'H', 'O', 'T' or 'V' string values). This special variable will be used to associate the subject's response input and the correct decision in the Procedure event (see Step 8 below).
3) click on the switch button to access the control settings palette.
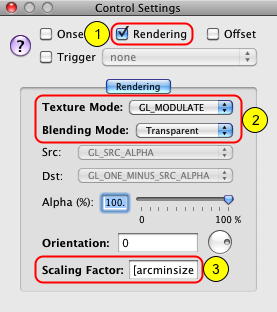
In the Control Settings palette:
1) check the Rendering box to access the Rendering options,
2) set the Texture Mode to GL_MODULATE and the Blending Mode to Transparent: this is necessary because all texts are rendered as OpenGL masking textures,
3) specify the scaling factor to apply on the optotypes so they appear at the size specified by the arcminsize variable (acuity expressed in arc minute unit, 1 arcmin corresponding to 20/20 visual acuity): [arcmin]/(12*pixtodeg(512))
The denominator "12*pixtodeg(512)" is a normalizing factor so 512 pixels (the font size we specified) correspond to 5*1 arcmin (ie 5 / 60 = 1 / 12 deg). The pixtodeg() function allows to perform this conversion irrespective of the chosen viewing distance.
We have finished with the stimuli design so click on the OK button in the properties panel to validate the changes and return to the Designer panel. Now we are going to customize the experiment properties and specify the value of the arcminsize variable.
Step 5: Customizing the Experiment
From the Designer panel, select the Acuity Experiment event, and click on the Inspector button to inspect its properties.
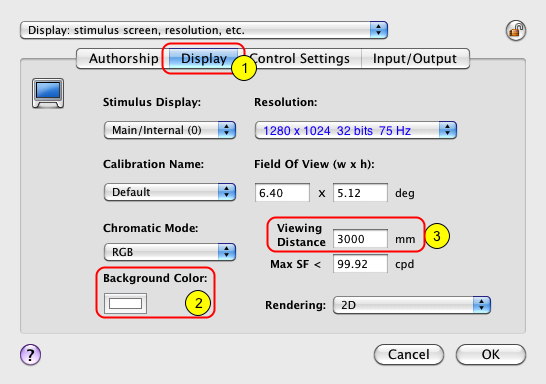
First let's customize the Display settings of the experiment:
1) click on the Display tab to view/edit the display settings, ie. those settings that affect the stimuli rendering on the experimental display,
2) change the Background Color to white,
3) set the Viewing Distance to whatever value you intend to measure visual acuity from,
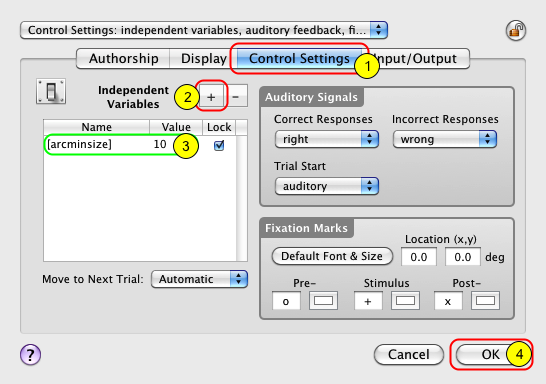
Then let's customize the Control Settings of the experiment:
1) click now on the Control Settings tab to view/edit the control settings, ie. those settings that affect the experimental protocol,
2) click on the '+' button to add an entry in the Independent Variables table,
3) edit this entry and name it arcminsize and specify its value (10 arcmin in this example, corresponding to 1 LogMAR unit, 20/200 in foot unit or 6/60 in meter unit),
4) click on the OK button to validate these changes and return to the Designer panel.
We have declared arcminsize as an independent variable here only for demonstration purpose. We will change it later to a dependent variable since this is the stimulus parameter that will vary across the trial when measuring visual acuity.
Step 6: Testing the Stimulus Presentation
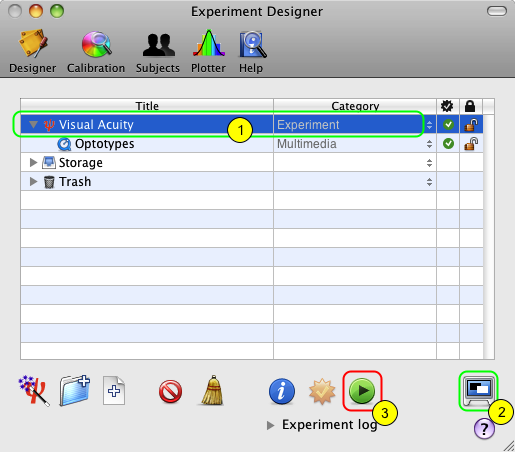
Though we have only defined a stimulus in this experimental design, one can already run it and verify that the optotype is properly displayed:
1) select the Visual Acuity Experiment event,
2) toggle the experimental session between windowed or full-screen mode (this option is disabled when running Psykinematix in demo mode),
3) click on the Run button to run this experiment (see Step 10 below for more details): a single optotype randomly selected should be presented at the size specified by the arcminsize variable.
Now we are going to implement the staircase method and the discrimination procedure necessary to measure the visual acuity threshold. Before going ahead make sure to remove the arcminsize independent variable from the Control Settings of the Experiment event (See Step 5 above and use the '–' button to remove the variable entry).
Step 7: Adding a Staircase Method
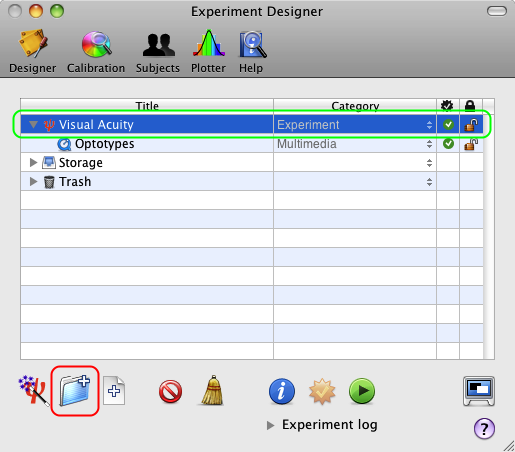
Select the Experiment event and add a new group event by clicking on the '+' folder icon again.
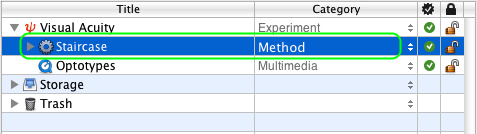
Change the title and category of the new event to Staircase and Method as illustrated. Then make sure the Staircase event is selected and click on the Inspector button to access its properties panel.
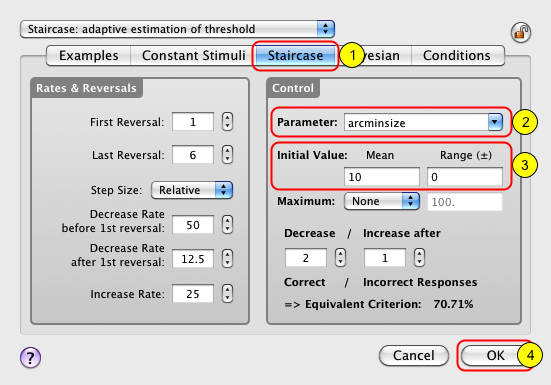
In this properties panel, the default settings are suitable for a standard staircase method but they can be customized to better fit your experimental requirements. The mandatory changes are those associated with the stimulus parameter that drives the threshold estimation during the experiment and its initial value:
1) control-click on the Staircase tab to select the Staircase Method if it is not yet selected,
2) enter arcminsize in the Parameter text field: this is the dependent variable of this experimental design,
3) set the Initial Value of the staircase parameter (randomly selected in the range specified by a uniform distribution, mean ± deviation): here the staircase method will always start with the same size (10 arcmin),
4) click on the OK button to validate these changes and return to the Designer panel.
Step 8: Adding a Discrimination Procedure
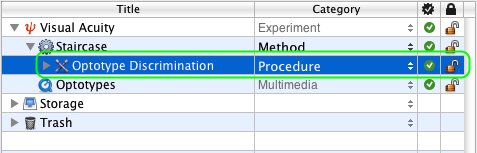
Similarly to the previous step, select the Method event, add a new group event, and change its title and category to Optotype Discrimination and Procedure. Then make sure this new Optotype Discrimination event is selected and click on the Inspector button to access its properties panel.
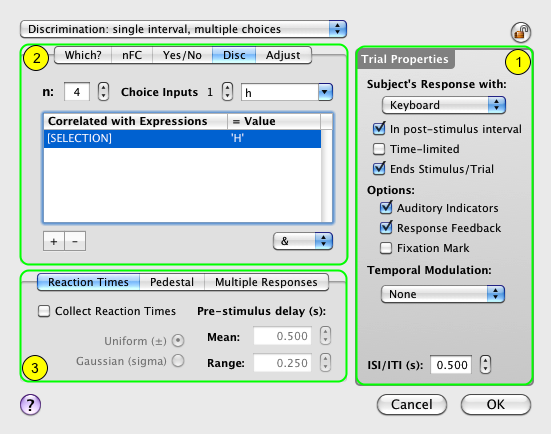
The properties page for the Procedure event consists of three sections:
1) a right side common to all procedures that specifies the properties to be applied to each trial,
2) a top-left section that specifies the properties of the selected procedure,
3) a bottom-left section that provides more customization for some of the procedures (eg, reaction times and pedestal),
You should customize each of these sections to fit your experimental requirements. Let's customize these sections so they look like the above panel.
First in Trial Properties:
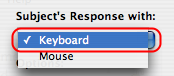
- change the type of inputs used by the subject to provide his/her responses: select the Keyboard device instead of the default. Here the h,o,t and v keys will be used by the subject to indicate the recognized letter.
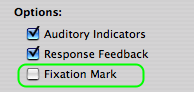
- uncheck the Fixation Mark option, so no fixation is displayed during the optotype presentation (pre- and post-stimulus fixations may be still present).
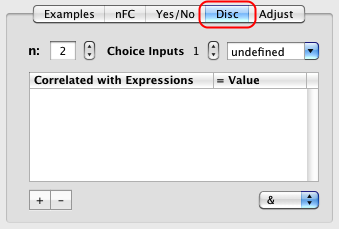
Second in the procedure-specific section of the panel:
- control-click on the Disc tab to select the Discrimination Procedure if it is not yet selected,
- specify a 4AFC discrimination task by setting n to 4 which corresponds to the number of response choices (4 letters).
- enter the subject response associated with each alternative decision: select the first choice index with the stepper (1 in the above figure) and enter the keyboard keys (h in the figure) corresponding to the H letter decision. Similarly, set the response keys (o, t and v) for the other choice indices corresponding to the O, T and V letter decisions.
Tip: Several inputs, separated by a comma, can be specified for the same decision.
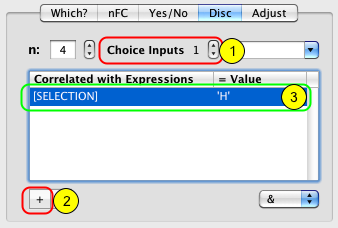
- finally indicate explicitly the correct decision for each choice input using the appropriate stimulus variables and their expected values:
1) select the choice input,
2) click on the '+' button to add an expression entry in the table,
3) under the "Correlated with Expression" column enter the stimulus dependent expression and its expected value under the "= Value" column.
As emphasized in Step 4, the value of the system-defined variable [SELECTION] specifies the optotype presented in the current trial. So here we simply have to indicate that the correct response for each choice input (h,o,t,v) is provided when the value of the [SELECTION] variable corresponds to the associated letter ('H','O','T','V').
Click on the OK button to validate the changes and return to the Designer panel.
Step 9: Finalizing the Design
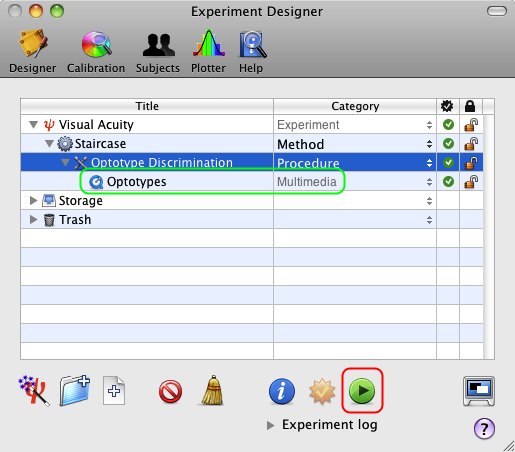
To finalize the hierarchical structure of the experimental design, drag the Optotypes stimulus into the Optotype Discrimination procedure as illustrated above. This is a critical step to ensure that the experiment will correctly work.
Now we are ready to run the final experimental design: click on the Run button to start the experiment and measure visual acuity using a staircase method.
Step 10: Running the Experiment
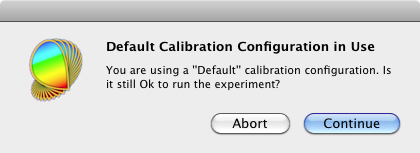
This warning message is displayed when no calibration configuration is specified for the experiment running (see the end of the Calibration Tutorial to learn how to specify a calibration configuration); however, you can still run the experiment using a default calibration by clicking on the Continue button.
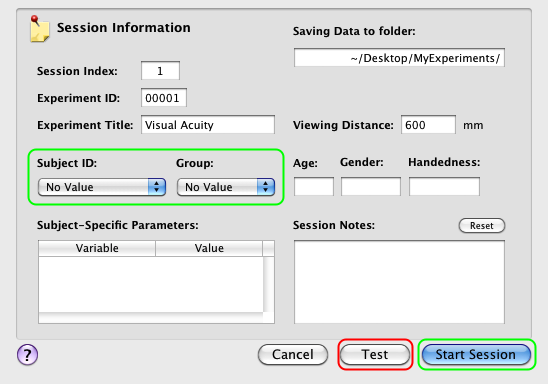
If you are running the experiment in full-screen mode, you will then be presented with this Session Information panel (the experiment will just start otherwise): you can either run the session in testing mode which does not require the specification of the subject and group, or in real mode if you specify them. In testing mode, no session data is actually saved in the results database.
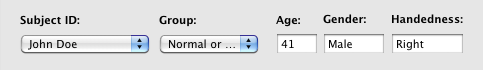
If you have already entered subjects and groups in the Subjects panel (see the Subjects Tutorial), you can select them using the two pop-up menus provided. Their age, gender, and handedness are then shown.
Click on the Start Session button.
Press ESC (escape keyboard key) to stop the session at any time.
Step 11: Visualizing the Results
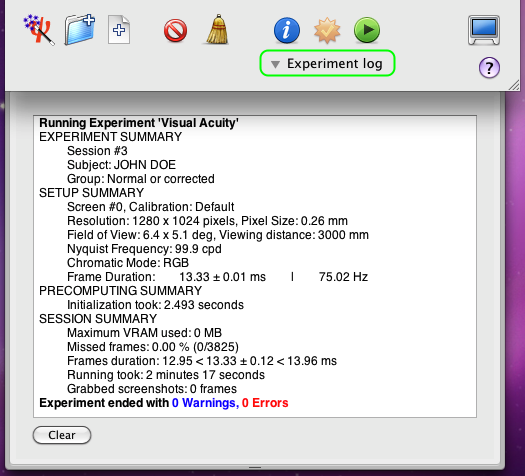
Once the session has completed normally, you are asked to press ESC to return to the Designer panel. If an error occurred during the session, a logging panel will automatically show up with relevant error and warning messages. This panel also includes a summary of the experimental conditions in terms of subject, display setup, and various other diagnostic information. If no error occurred, you can still reveal this panel by clicking on the small arrow Experiment log.
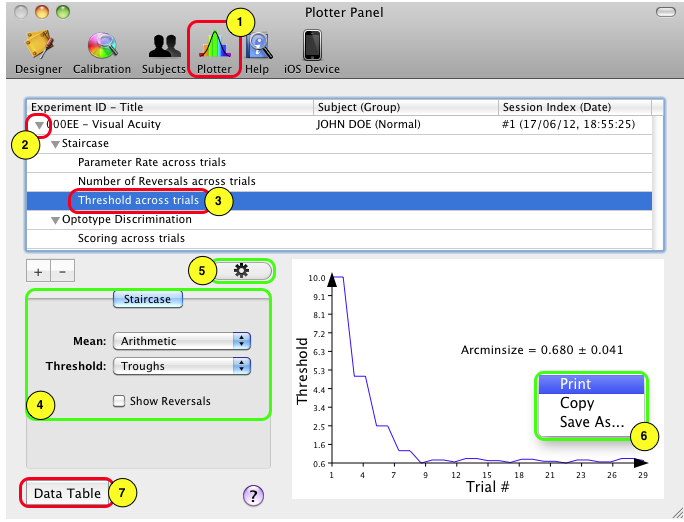
Upon termination of an experimental session, results data are created and saved in the Psykinematix database. The session data can also be visualized immediately on the Plotter panel:
1) click on the Plotter icon in the toolbar to access the panel,
2) option-click on the small arrow in front of the session entry to expand the whole hierarchy of the results data,
3) select one of the entries in the final level of the hierarchy to plot its attached dataset (each entry contains a different dataset),
4) optionally customize the measurements (in the above example options are available for threshold estimation measured through a staircase method),
5) click on the graph properties option to customize its appearance (through the graph properties palette),
6) control-click inside the graph to print, copy, or save it to a file.

7) click on the arrow to reveal the spreadsheet containing the selected data used to plot the graph (control-click inside the spreadsheet to print or export the data).
See the Subjects Tutorial and the Plotter Tutorial to learn how to select, import, and plot data collected during previous Psykinematix sessions.
Conclusion
In this lesson, you learned the Psykinematix basics: how to create the hierarchical structure of an experiment, how to customize the events, how to use variables to connect procedural and stimulus events, and how to run a session and inspect the results.
In the next lesson, you will learn how to add crowding bars around the optotypes (Lesson 2). You may also consider the following lessons to learn how to:
- interleave several staircases to investigate the effect of another parameter (Lesson 2 on Contrast Sensitivity),
- implement a sandwich paradigm with forward and feedback masking noise (Lesson 3 of Orientation Discrimination),
- add a spatial and temporal context (Lesson 4 of Orientation Discrimination).